


Introduction
Crohn’s disease (CD) is a chronic progressive, relapsing, and remitting inflammatory condition affecting the gastrointestinal tract, and in 30% of patients it leads to complications such as strictures, fistula, abscesses, and perianal forms [1]. According to a meta-analysis by Yaron in 2020, CD complications can lead in up to 23.3% of cases to hospitalization, and in 12.4% to further surgical treatment [2]. Despite the increasing development of new medications, medical or surgical hospitalization remains central to all direct healthcare costs, reaching in 2020 approximately 3500 Euro per CD patient per year [3, 4].
Penetrating disease, perianal or foregut involvement, young age at the time of diagnosis (< 40 years), smoking, and early start of corticosteroid therapy have been identified as high-risk features for required surgery (risk ratio (RR) 13.67, 95% confidence interval (CI) 1.88–99.41) and hospitalization (RR = 1.86, 95% CI: 0.03–0.43) [5]. In a recent systemic review by Tang et al. in 2023, body composition parameters were shown to predict poor outcomes for CD patients [6]. Sarcopaenia was associated with longer disease duration, more complex phenotype, and disease activity [6]. Additionally, sarcopaenia was revealed as a risk factor for the requirement of surgical intervention (hazard ratio (HR) = 4.31, 95% CI: 1.36–13.7) and for postoperative complications (HR = 3.84, 95% CI: 1.48–9.974) [6–8].
Sarcopaenia as progressive and generalized degenerative loss of skeletal muscle mass occurs in CD patients primarily due to malnutrition caused by chronic bowel inflammation (IBD). A population-based study by Sharif et al. in 2022, including 2085 patients with polymyositis (PM) and dermatomyositis (DM) and 10,193 patients as a control group, demonstrated the incidence of IBD in PM/DM patients to be significantly higher (OR = 1.73, 95% CI: 1.05–2.86) [9]. Its results, such as reported clinical cases of the appearance of ocular or gastrocnemius myositis in CD patients, confirm the hypothesis of a crucial role of low-grade systemic inflammation in the disturbance of skeletal muscle homeostasis leading to sarcopaenia [10–13].
Thus, there is a need for additional methods of assessing the degree of muscle mass loss and the detection of intramuscular disorders like low-grade inflammation, which can significantly expand our diagnostic and prognostic values in patients with Crohn’s disease. In recent studies, it was demonstrated that diffusion-weighted imaging quantified by apparent diffusion coefficient can reflect intramuscular microstructure disorders, for example, in the case of tumours or muscle cell lysis in myositis [14, 15]. Furthermore, in 2018, Surov et al. showed that ADC can be used as an imaging biomarker of myopathic changes in liver cirrhosis [16].
Aim
Therefore, the aim of this study was to assess the relationship between ADC values of the skeletal musculature and the activity or behaviour of CD as high-risk features.
Material and methods
Our retrospective study was conducted in the University Clinic for Radiology and Nuclear Medicine (University Hospital Magdeburg) and approved by the Institutional Review Board Ethics Committee (Number: 145/21), Otto-von-Guericke University, Magdeburg, Germany. Patients with confirmed CD, who underwent magnetic resonance enterography (MRE) between June 2010 and April 2020 were included. Each MRE was performed on a 1.5 Tesla MR scanner (Intera, Philips Healthcare, Best, Netherlands) in a supine position using a whole-body surface coil system. Our MRE protocol has been previously reported, and the MRI sequences are summarized in Supplementary Table SI [17, 18].
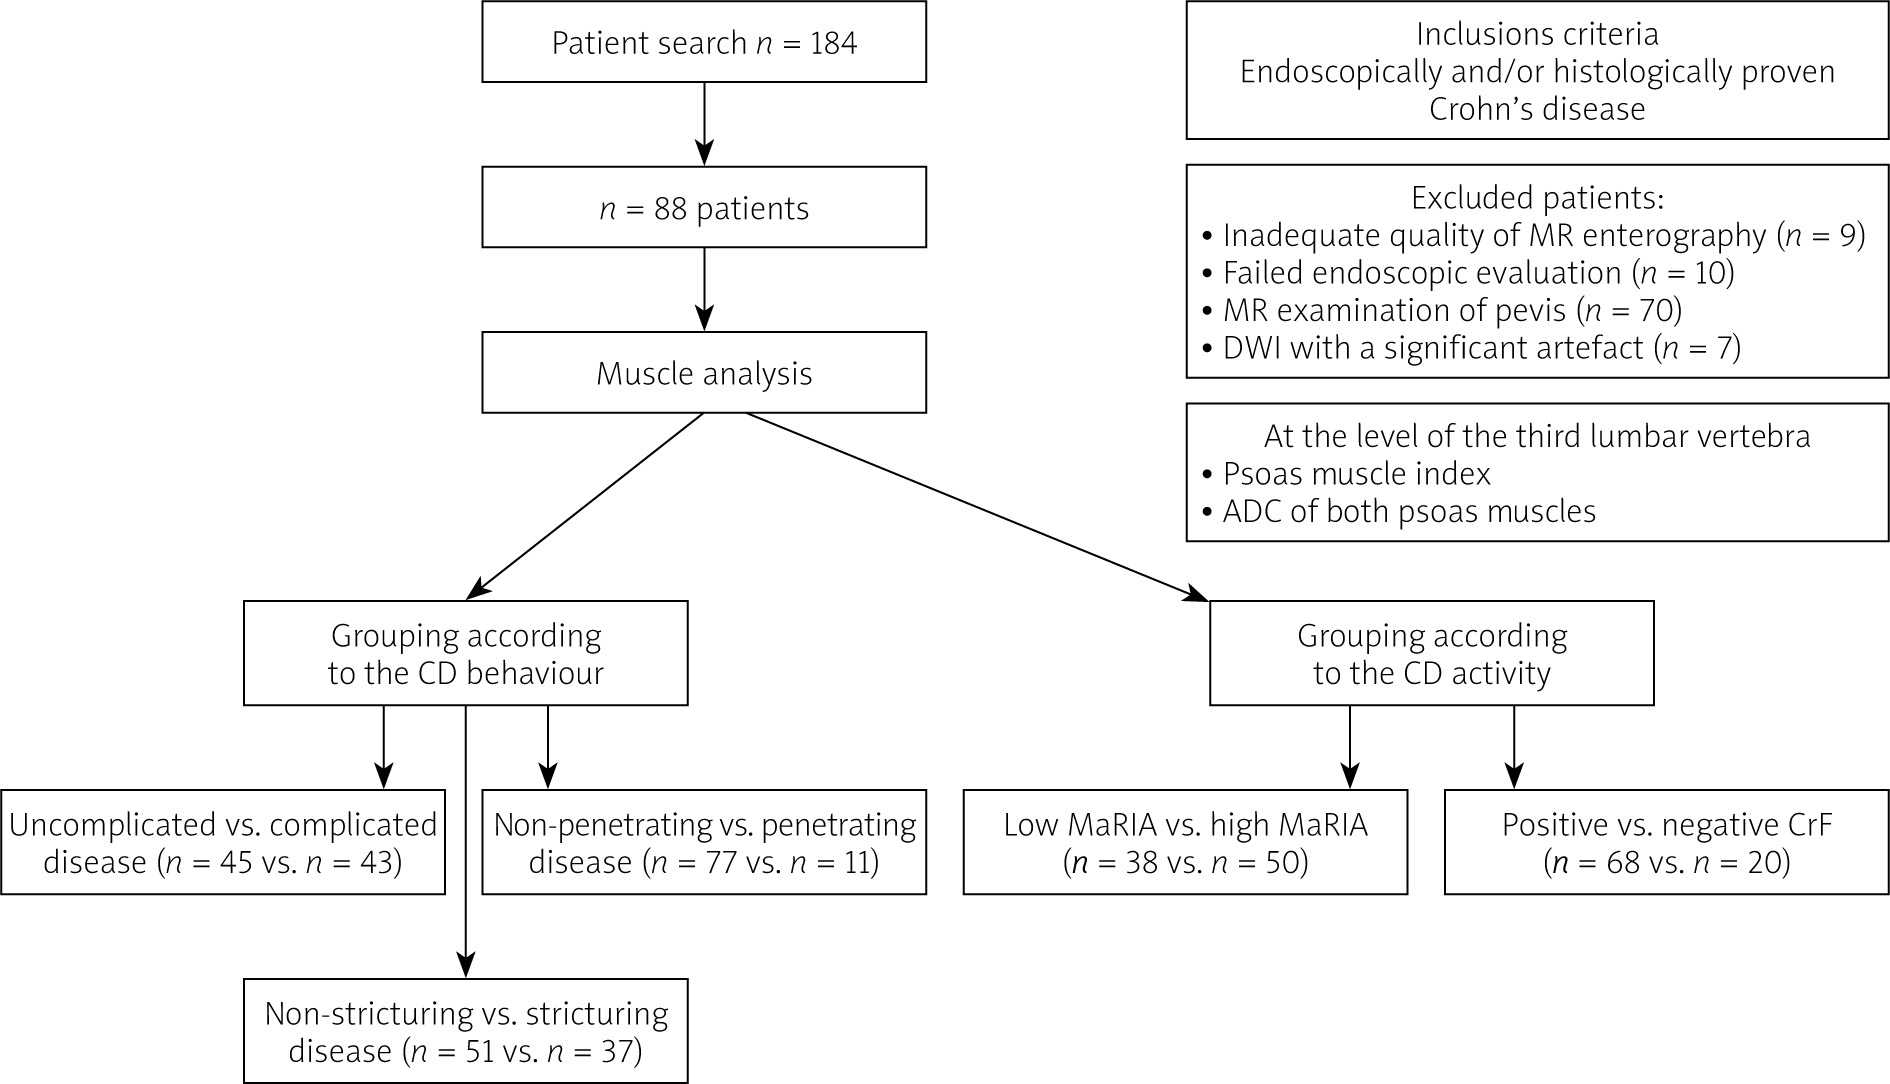
Clinical data were extracted from our internal database (MEDICO KIS, CompuGroup Medical SE & Co. KGaA, Koblenz, Germany) and comprised sex, weight, height, age, smoking, duration of disease, CRP, complications (stricture, fistula, abscess), medications, and previous abdominal surgery. The study design is depicted in Figure 1, and it included muscle analysis and assessment of CD activity and complications.
Figure 1
Study design CD – Crohn’s disease, CrF – creeping fat, MaRIA – Magnetic Resonance Index of Activity, DWI – diffusion-weighted imaging, ADC – apparent diffusion coefficient.
Setting and participants
Our inclusion criteria were as follows: (a) endoscopically and/or histologically confirmed CD, (b) complete demographic and clinical data, (c) the first MRE chronologically available, (d) performed DWI without reduced quality.
The exclusion criteria were as follows: (a) incomplete clinical data (b) strong MRE artifacts, and (c) MRI of the pelvic region.
Muscle analysis
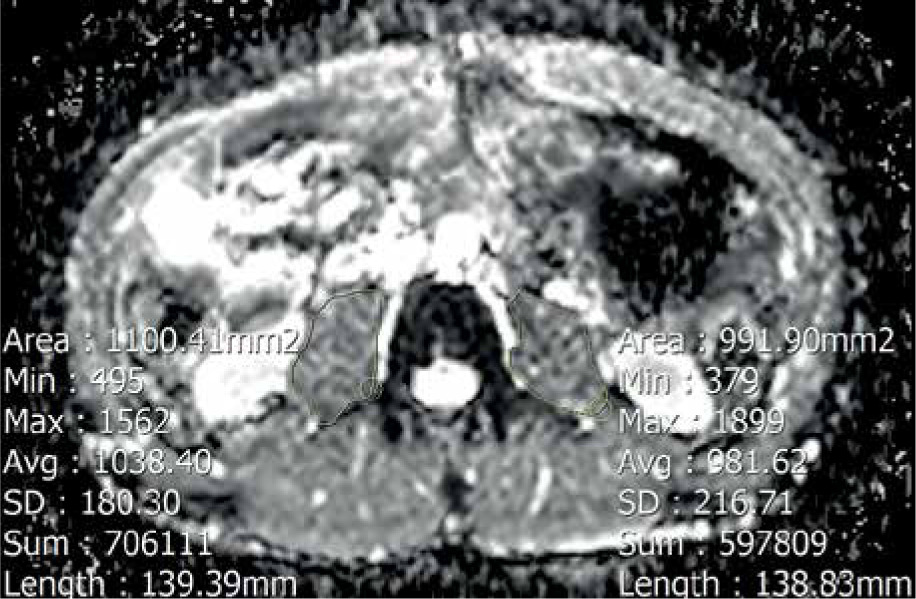
We performed our assessment at the level of the third lumbar vertebra. The analysis included measuring the cumulative mean ADC value of both psoas muscles. ADC value was measured by drawing polygonal regions of interest (ROI) along the contours of the psoas muscles in ADC maps, avoiding fat areas and vessels. The ROI placement is demonstrated in Figure 2.
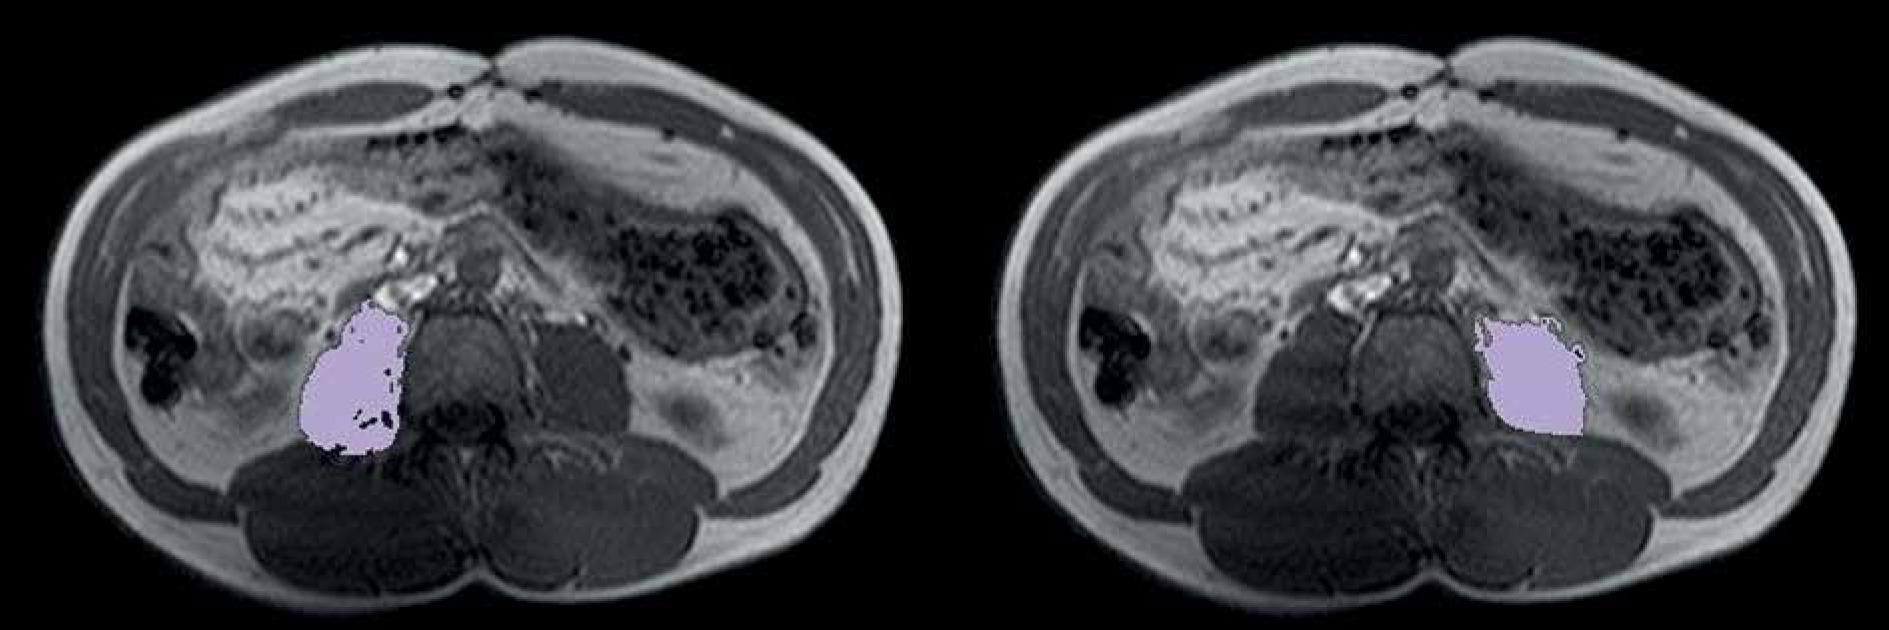
The psoas muscle area was estimated using the special semi-automated tool AsanJ-Morphometry (available at http://datasharing.aim-aicro.com/en/morphometry) also at the same level [19]. The separation of muscle and adipose tissue was performed according to thresholds for the signal intensity on precontrast T1-weighted MRI scans with the values between 350 and 750 signal intensity (SI) for adipose tissue and between 100 and 350 SI for muscle tissue. The psoas muscle index (PMI) was calculated by dividing the psoas muscle areas of both sides by the patient height squared (cm2/m2) [20] (Figure 3).
Assessment of CD activity
The CD activity we evaluated using the Magnetic Resonance Index of Activity (MaRIA), which was estimated in the segment with the most severe changes according to the formula (1.5 × wall thickness [mm] + 0.02 × relative contrast enhancement [RCE]). RCE was calculated as follows: RCE = (wall signal intensity [WSI] post gadolinium- WSI pre-gadolinium/[WSI pre-gadolinium]) × 100 × (standard deviation [SD] noise pre-gadolinium/SD noise post-gadolinium). SD noise before and after gadolinium administration was performed as the average of 3 SD of the signal intensity measured outside the body. Patients were dichotomized using a cut-off value of MaRIA score into 2 groups: mild-to-moderate disease (MaRIA < 11) and severe disease (MaRIA ≥ 11) [21].
Additionally, each MRE was assessed on the presence of stricture, fistula, abscess, and fatty deposition along an inflamed bowel loop known as creeping fat (CrF) [22, 23]. CD behaviour was categorized according to the Montreal classification into 3 groups: non-stricturing, non-penetrating (B1), stricturing (B2), and penetrating (B3) [24].
Statistical analysis
Continuous variables were expressed as mean (M) and standard deviation (SD). Categorical variables were demonstrated in percentages. Continuous variables were compared between groups using Student’s t-test. The intraclass correlation coefficient (ICC) of a subset of 30 patients was calculated for each pair of ADC, PMI, and MaRIA values to determine the intra- and interobserver agreement. Also, for CrF as a categorical variable Cohen’s κ was used test to evaluate intra- and interobserver agreement. Values of 0.61–0.80 were interpreted as substantial and 0.81–1.00 as excellent agreement. A p-value of 0.05 was considered statistically significant. We performed analyses using a statistical software package (SPSS Statistics for Windows, version 27.0, IBM Corp., Armonk, NY, USA).
Results
According to our inclusion criteria, we found retrospectively MRI examinations of 184 patients with CD, where 96 patients were excluded (MRI of the pelvis – 70 patients; inadequate MRE quality – 9 patients; failed endoscopic evaluation – 10 patients; DWI with a significant artefact – 7 patients) (Figure 1). Therefore, 88 patients were finally enrolled in our study.
The baseline characteristics are summarized in Table I. Our study included 41 (46.6%) females, the mean age of the cohort was 38.69 years, and the main part of patients belonged to the A2 age group (with onset of disease between 17 and 40 years). Complications (complicated disease B2 + B3) such as strictures, fistula, and abscess were observed in 43 (48.9%) patients. Almost half of our candidates (n = 51, 58.8%) had conservative therapy; previous abdominal surgery was observed only in 35 (39.8%) patients. The study included 10 current smokers (11.4 %), and the levels of C-reactive protein (CRP) were beyond the upper limit of 5 mg/l for 75% (n = 66). Mostly, we found patients had normal weight (n = 58, 65.9%).
Table I
Baseline characteristics (n = 88)
In the next step, we compared the muscle parameters such as mean ADC and mean PMI of both psoas muscles in patients according to each parameter, which defined the disease behaviour and activity (Table II). Analysing the behaviour type, we found a significant difference in ADC between uncomplicated disease (B1, n = 45) and complicated disease (B2 + B3, n = 43) with mean values of 1.11 ±0.19 (10–3*mm2/s) and 1.03 ±0.10, respectively (p = 0.02). ADC was also significantly higher in non-stricturing patients (n = 51) than in patients with strictures (n = 37) (1.10 ±0.18 and 1.02 ±0.11, respectively, p = 0.01). There was no clinically and statistically significant difference in ADC values in patients with non-penetrating disease vs. penetrating disease (p = 0.65) or patients with vs. without positive CrF (p = 0.44). Also, we did not find any significant difference in patients with low and high MaRIA (p = 0.92). In the assessment of PMI, patients with non-penetrating disease showed clinically higher values than those with penetrating disease (5.71 ±1.88 vs. 4.42 ±1.55 cm2/m2, respectively, p = 0.10). According to other parameters such as low and high MaRIA, negative vs. positive creeping fat, uncomplicated disease vs. complicated disease, and non-stricturing vs. stricturing disease, there was no statistical or clinically significant difference.
Table II
Mean apparent diffusion coefficient (ADC) of the psoas muscle and psoas muscle index (PMI)
Intra- and interobserver agreement
The intraobserver and interobserver assessment was performed for evaluating CrF and measuring ADC, PWI, and MaRIA. The obtained results demonstrated excellent agreement (κ = 0.831, ICC more than 0.891, p < 0.05) and are summarized in Supplementary Table SII.
Discussion
To our knowledge, this is the first study to evaluate the association of lumbar muscle ADC values and PMI with CD activity and behaviour. Our results showed a significant difference in ADC values in patients with uncomplicated and complicated disease (p = 0.02), as well as non-stricturing and stricturing diseases (p = 0.01).
In recent years, the prognostic value of body composition parameters in CD patients has been a trending topic. The systematic reviews by Ryan et al. and Tang et al. reported the incidence of sarcopaenia in approximately 52% of CD, which influenced the inflammatory status, disease behaviour, prognostic outcome, and the effectiveness of drug therapy [6, 25]. According to the current “gut-muscle axis” hypothesis, there is a need to study intramuscular changes, which appear due to the systemic influence of low-grade inflammation in CD patients, to detect earlier the CD forms with poor prognosis [6, 12].
Previous studies have confirmed DWI and ADC efficacy as useful clinical tools to identify the pattern of intramuscular disorders based on changes of free water motion and increasing cellularity [14, 16, 26–32]. Meyer et al. in 2018 showed significantly higher muscle ADC values in myositis and myopathy than in unaffected muscles, which was generally related to the appearance of muscle oedema [14]. In subsequent studies, Meyer et al. showed a strong correlation between ADC and electromyography findings in myositis, allowing it to reflect a functional muscle condition [32, 33]. Not only structural but also functional changes can be detectable by ADC. For instance, Morvan et al. found changes of ADC values after physical exercise due to increased perfusion and delated vascular spaces [34].
For an adequate and standardized comparison of the assessment of muscle loss and the measurement of ADC value, we chose the lumbar muscle due to the low incidence of artefacts, especially on ADC maps, and the simplicity of the measurement method. The assessment of the lumbar muscle loss using PMI showed no significant difference in patients with non-penetrating (B1 + B2) and penetrating disease (B3) (p = 0.10). Zhou et al. in 2021 found an association of low muscle-related parameters with complicated disease behaviour (p = 0.048) [35]. Further studies showed a relationship between muscle loss, especially in combination with mesenteric fat index or high visceral fat, and poor outcomes in CD patients [7, 36]. On the other hand, the assessment of ADC values showed significantly lower values in patients with complicated disease compared to uncomplicated or stricturing compared to non-stricturing disease (p = 0.02 and p = 0.01, respectively). Ran et al. obtained lower ADC values in patients with myositis against control groups with unaffected muscles [30]. They explained these changes by the appearance of cytotoxic reactions within the muscle. Another hypothesis was proposed by Dalakas et al., who associated diffusion changes with an increase of cellularity due to the migration of inflammatory cells and also with subsequently intensified inflammatory processes with oedema and necrosis of muscle fibres, and as a result, an increase of the diffusion space for water molecules [37, 38].
The CD activity analysis based on CrF or measuring the MaRIA score did not show any significant difference in ADC or PMI values between all groups. A possible explanation might be the influence of treatment on MaRIA, especially the duration and scheme of treatment, which was not considered. According to the literature, MaRIA correlates with general inflammation parameters such as CRP and mucosal healing, which are highly dependent on the patient’s treatment [39–44]. However, we see significant potential in further studies of activity based on MaRIA score and muscle change, because this relationship can improve our knowledge of the systemic influence of bowel inflammation on muscle changes.
Summarizing the obtained results, we see in them a significant clinical value. Firstly, the measurement of ADC values is simple and corresponds to the methodology of assessment of composite parameters of the body. Secondly, the statistically significant difference of muscle ADC values in patients with a complicated and uncomplicated course and between stricturing and non-stricturing behaviour can contribute to identification of CD patients with a worse prognosis. Thirdly, further studies of intramuscular changes based on changes in ADC measurements could potentially lead to identifying CD patients with a lower risk for developing of abscess, fistula, and stricture at an early stage.
Our study has several limitations. It was a monocentric study with a retrospective design. There was no histological conformation of intramuscular changes; thus, distinguishing myositis from other muscle disorders was not possible. Not all patients with penetration complications received MRE; some patients with complications such as perforation or gastrointestinal bleeding required CT examination in the emergency setting. The follow-up time for each scan of the patients was not standardized, and, therefore, follow-up scans were not included in the analysis.